Top Tools for Workforce Data Dashboards
Workforce data dashboards simplify decision-making by turning complex datasets into clear visuals and actionable insights. These tools help organizations track metrics like headcount, turnover, and performance while incorporating AI-driven predictive analytics for future planning. Here's what matters most when choosing one:
- User-Friendly Design: Easy navigation saves time and boosts productivity.
- Data Integration: Tools with API, file-based, and pre-built connectors ensure seamless connections.
- Customizable Displays: Real-time updates, role-based views, and widget management improve usability.
- AI Features: Predictive analytics, sentiment analysis, and workload optimization enhance insights.
- Mobile & Cloud Access: Collaboration and real-time data access are critical for modern teams.
Quick Comparison
| Tool | Best For | Key Strength | Data Handling |
|---|---|---|---|
| Tableau | Visual analysis | Rich visuals | Live/in-memory |
| Power BI | MS integration | Scales well | 2B+ rows |
| Domo | Mobile teams | Mobile access | Cloud-native |
| Looker | Metric creation | Data consistency | SQL-based |
| Qlik Sense | AI insights | Pattern discovery | Associative |
Choose a tool based on your organization's needs for usability, integration, and advanced analytics.
HR Data Analytics & Awesome Dashboard with Power BI: End-to-End Project
How to Select Workforce Dashboard Tools
Picking the right workforce dashboard tool means focusing on features that make analyzing workforce data easier and more effective.
Simple Interface Design
A clear and easy-to-use interface is key for quick decision-making. Modern tools should offer straightforward navigation, allowing users to access and understand critical metrics without hassle.
According to DeskTrack, using user-friendly workforce analytics can improve productivity by up to 40%. This improvement happens because employees spend less time struggling with complicated systems and more time focusing on actionable insights.
"Make data more accessible with clear, engaging visualizations." - Lightcast
Data Source Connections
Integration is essential for creating a complete view of workforce data. With 37% of companies relying on five or more HR tech solutions, seamless data connectivity is a must. Look for tools that support:
- API Integration: Real-time access through RESTful and SOAP APIs
- File-Based Interfaces: To import data from older systems
- Pre-Built Connectors: Direct links to popular HR platforms
For example, PeopleInsight shows how efficient integration can make a difference by enabling HR dashboards to go live in just 5 days after receiving data. Fast implementation like this lets organizations quickly start using their analytics.
Once integration is in place, focus on visualization features to turn raw data into meaningful insights.
Display Options and Adjustments
Turning complex data into clear insights requires flexible and customizable display options. The best tools allow adjustments to fit different organizational needs while keeping the data easy to understand.
Important features include:
- Widget Management: Add, remove, and rearrange dashboard elements as needed
- Role-Based Views: Tailored dashboards for different levels of the organization
- Real-Time Updates: Automated data refreshes to keep information accurate
"Unleash business intelligence and better, data-driven decision making with a powerful and customisable dashboard builder. See costs, resources and so much more like never before, with easy to build charts and graphs." - Humanforce
When assessing display options, prioritize tools with automated updates to reduce manual work and minimize errors. This not only saves time but ensures the data remains reliable. Aim for solutions that combine advanced features with simplicity to encourage widespread use and deliver strong results.
sbb-itb-6487feb
5 Leading Workforce Dashboard Tools
Workforce dashboard tools are designed to tackle various data challenges, each offering unique features to meet different needs.
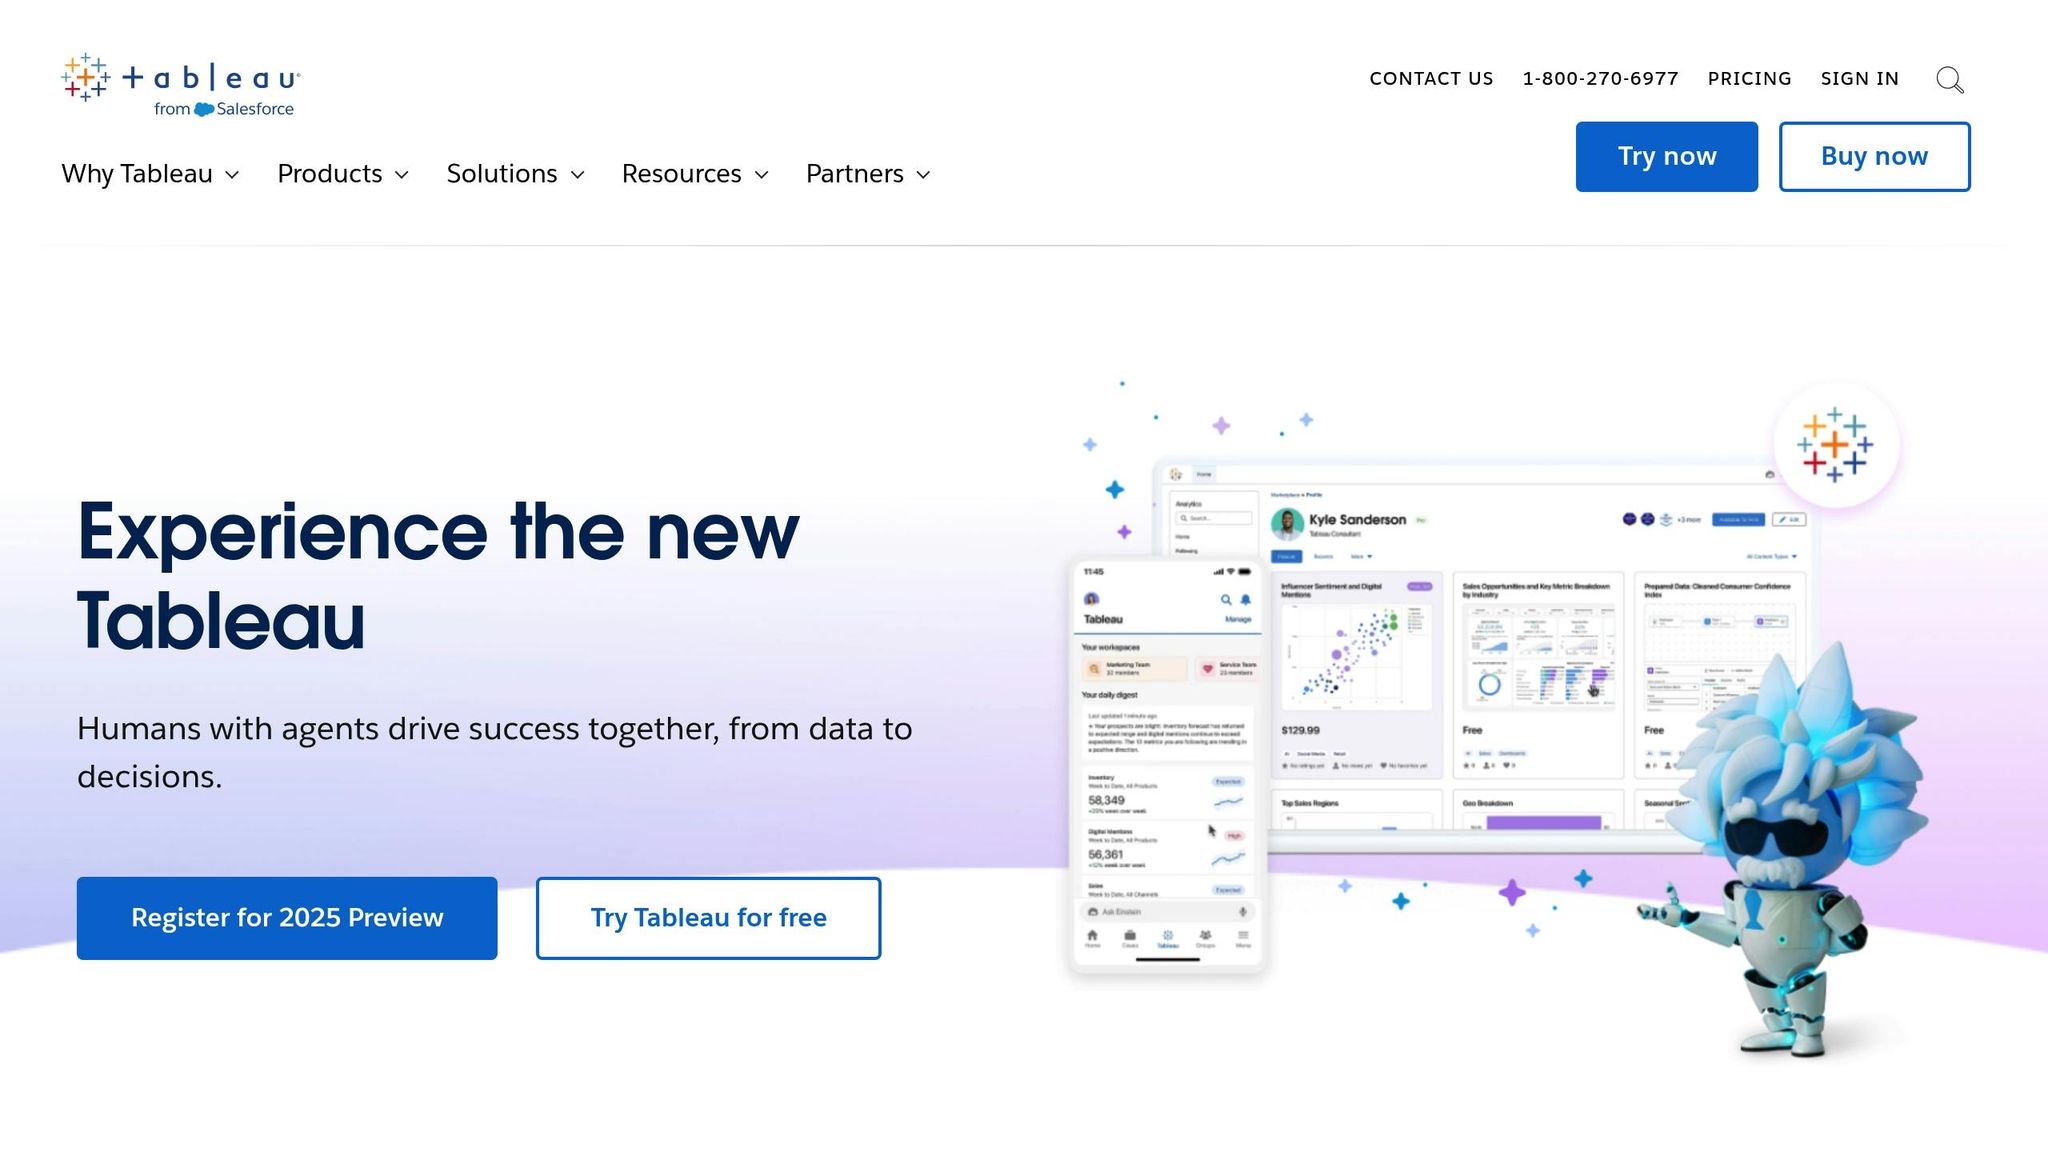
Tableau

Tableau stands out for its user-friendly drag-and-drop interface, making it easy to build workforce analytics dashboards. Its standout features include:
- Connections to multiple data sources
- Real-time visualization updates
- Advanced mapping with built-in geographic data
- A natural language "Ask Data" tool for quick insights
"The best part of Tableau has been the impact we see on the communities we serve. Data drives discussions about where we want to go, our expectations, our hopes, and the impacts we hope to have." - Leeza Kondos, Senior Data Scientist, USAID
Power BI
Power BI is built to handle enormous datasets, managing up to 2 billion rows of data. Companies like H&M and Rockwell Automation use it for tasks like data loss prevention and stakeholder reporting. Key features include:
- Smart Narrative visualization for automated insights
- Dynamic filtering for better data interaction
- Access to custom visuals through its marketplace
- Seamless integration with Microsoft products
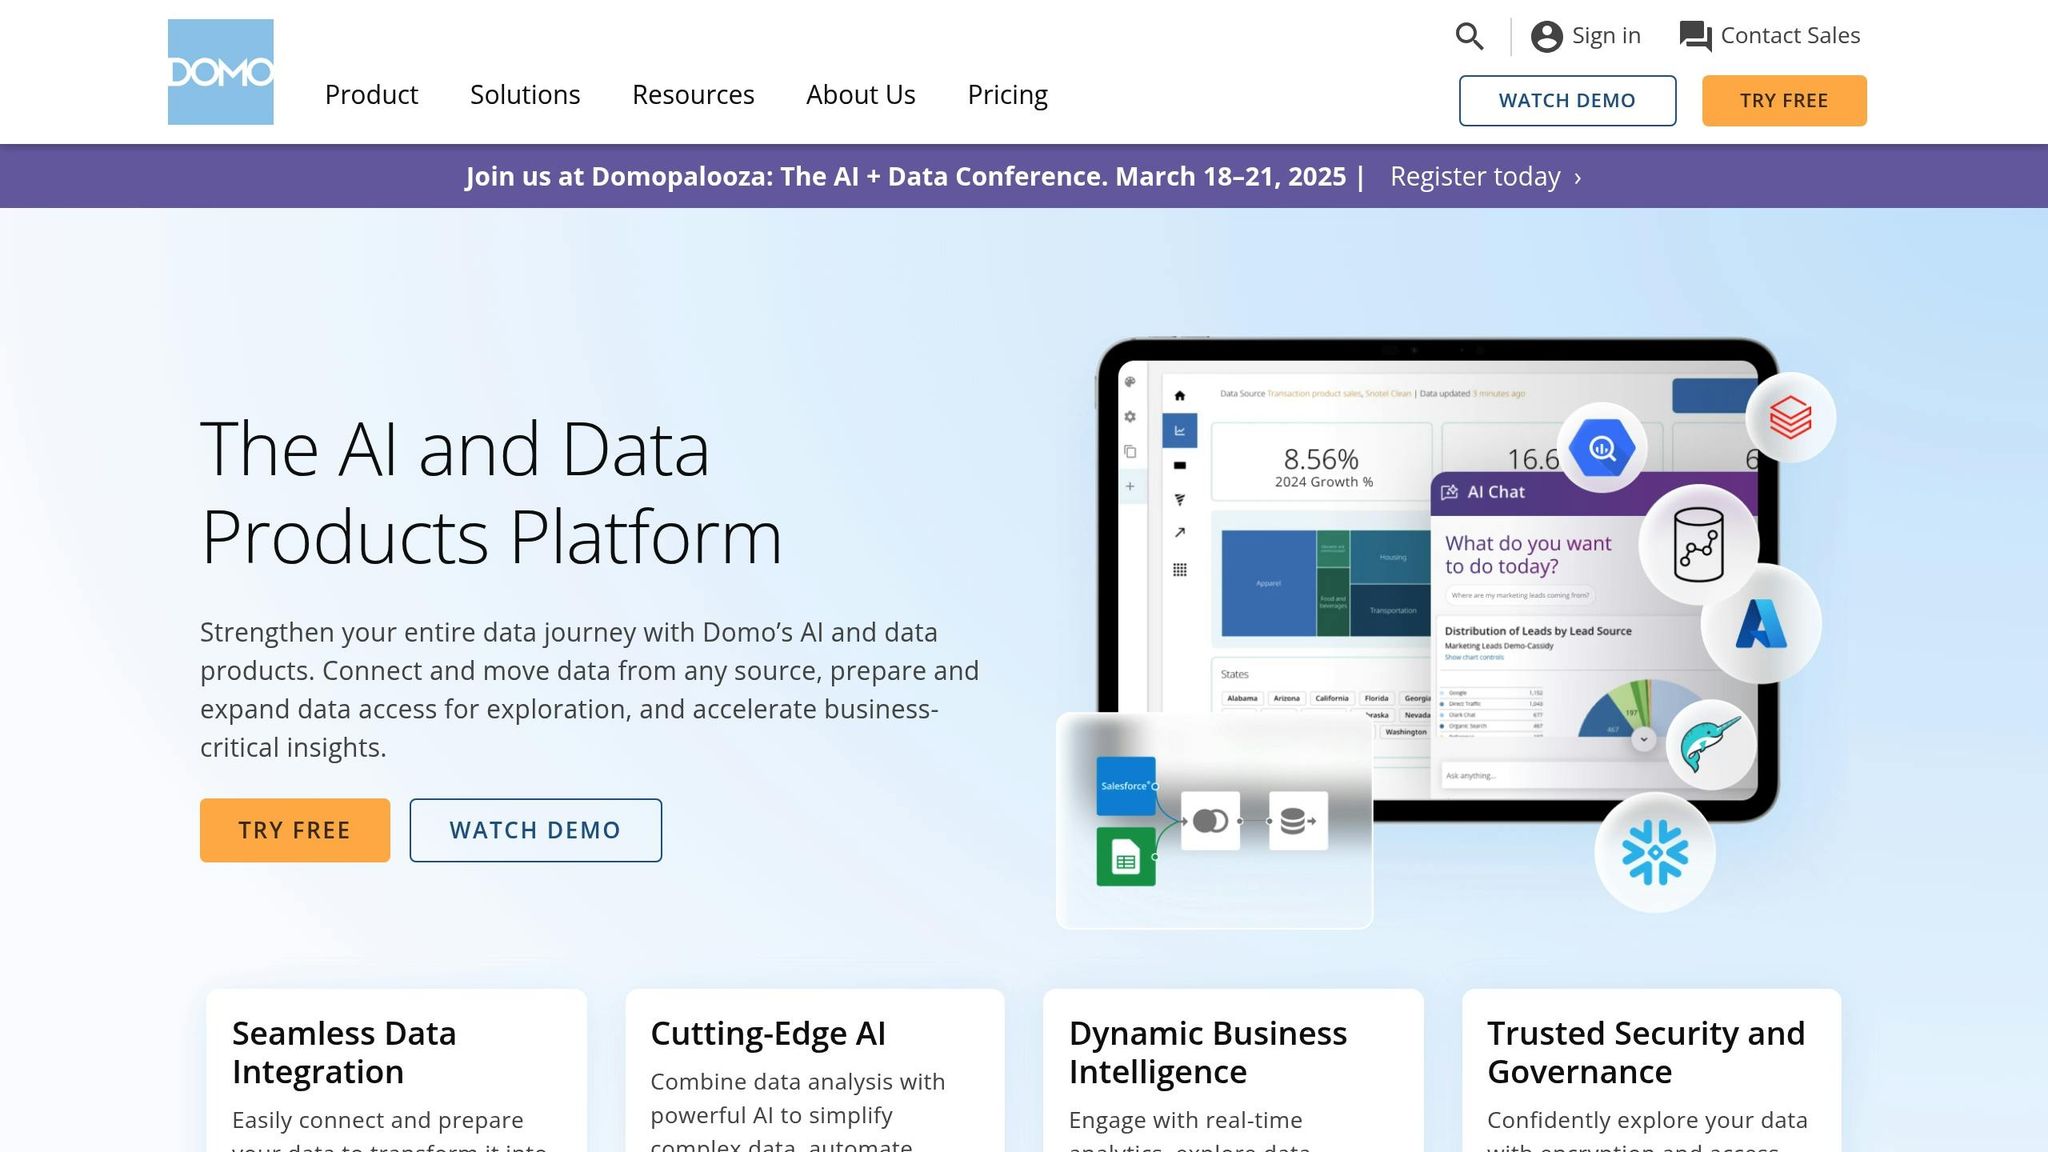
Domo

Domo focuses on mobile-first workforce analytics, making it ideal for teams that need data insights on the go. Its core features include:
- Tools for real-time collaboration
- Dashboards optimized for mobile devices
- A cloud-native structure
- Enterprise-level security features
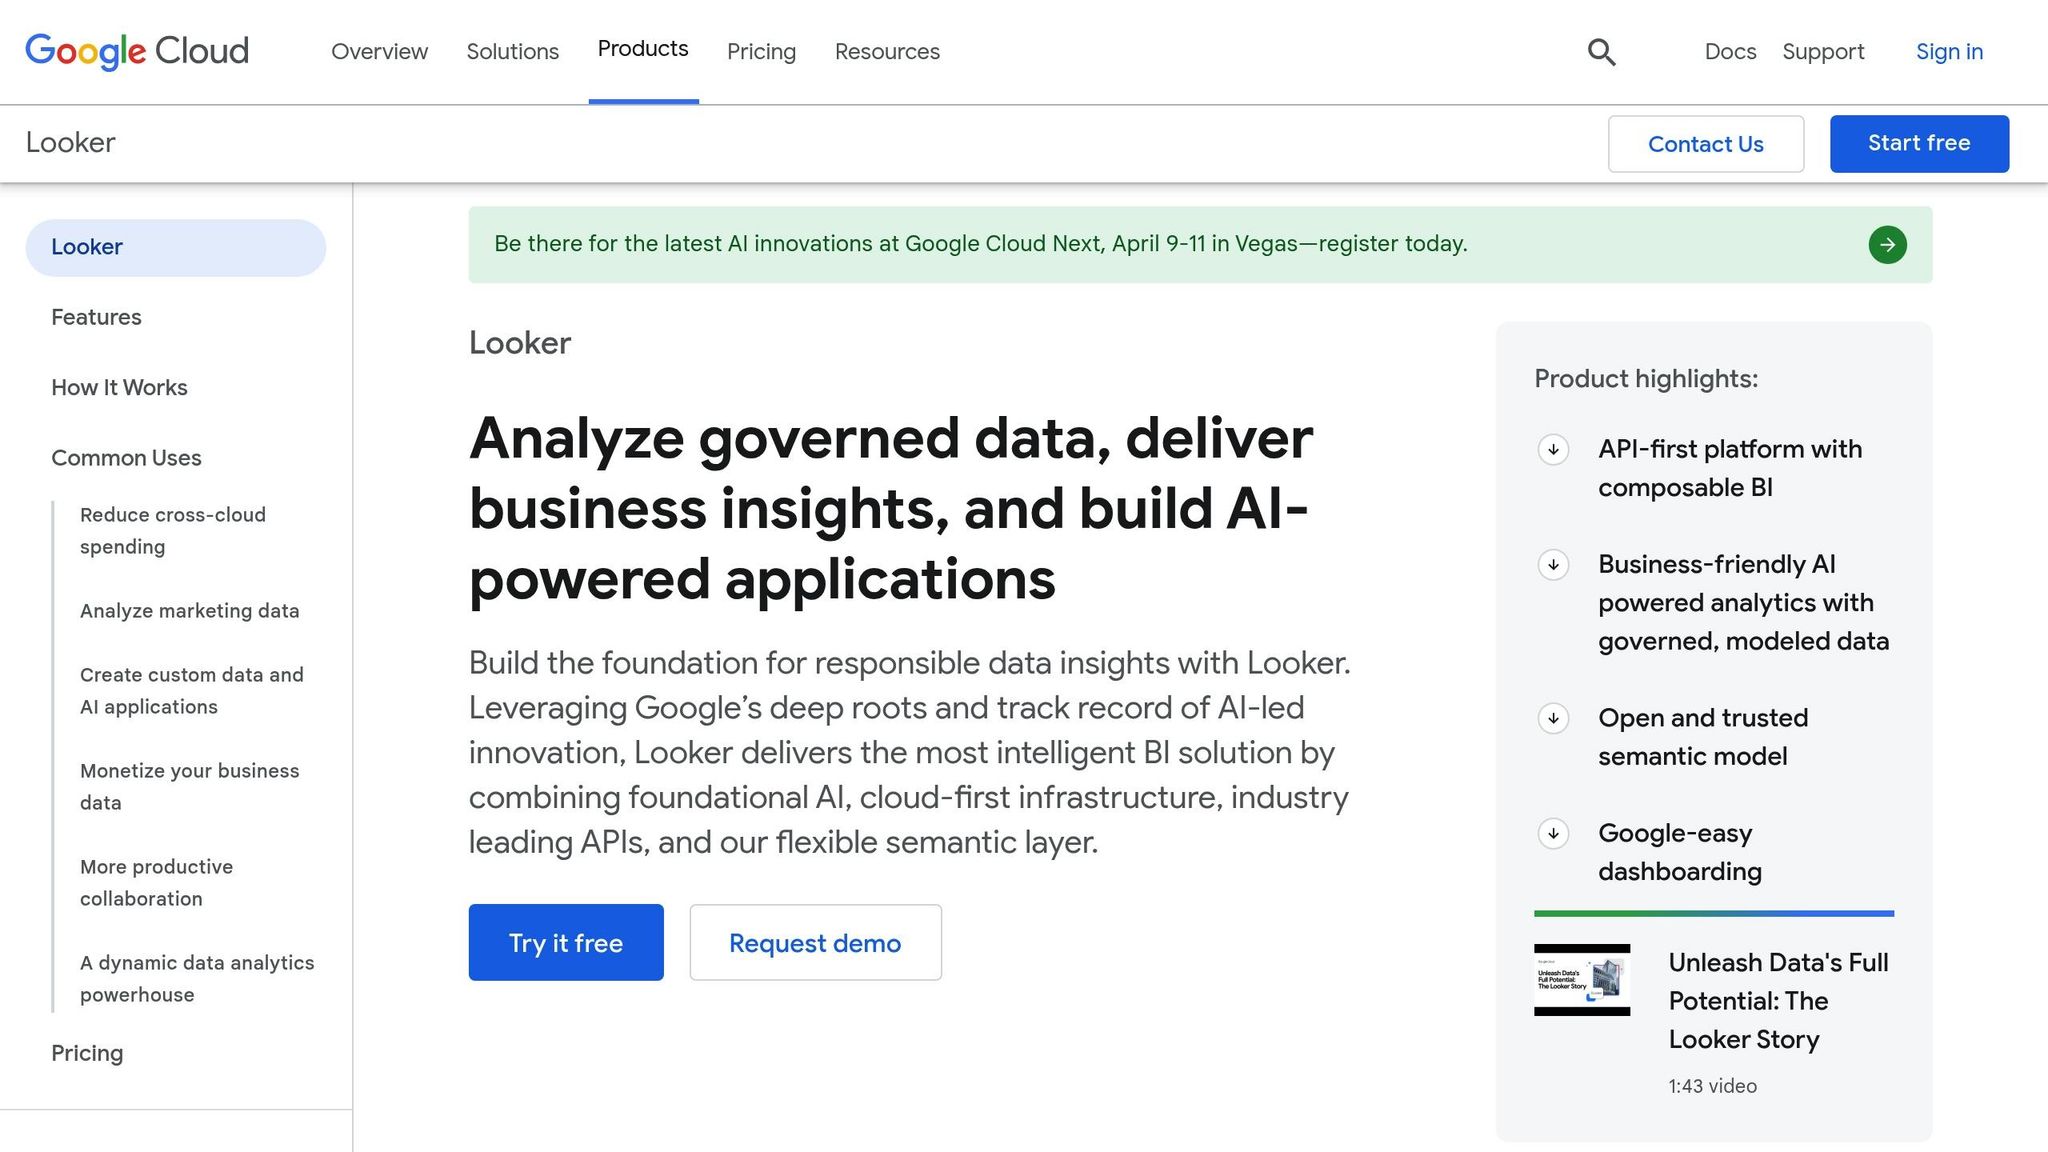
Looker

Looker simplifies workforce analytics by offering strong data modeling and customizable metrics. It ensures consistent data definitions across departments, making it easier to maintain unified insights.
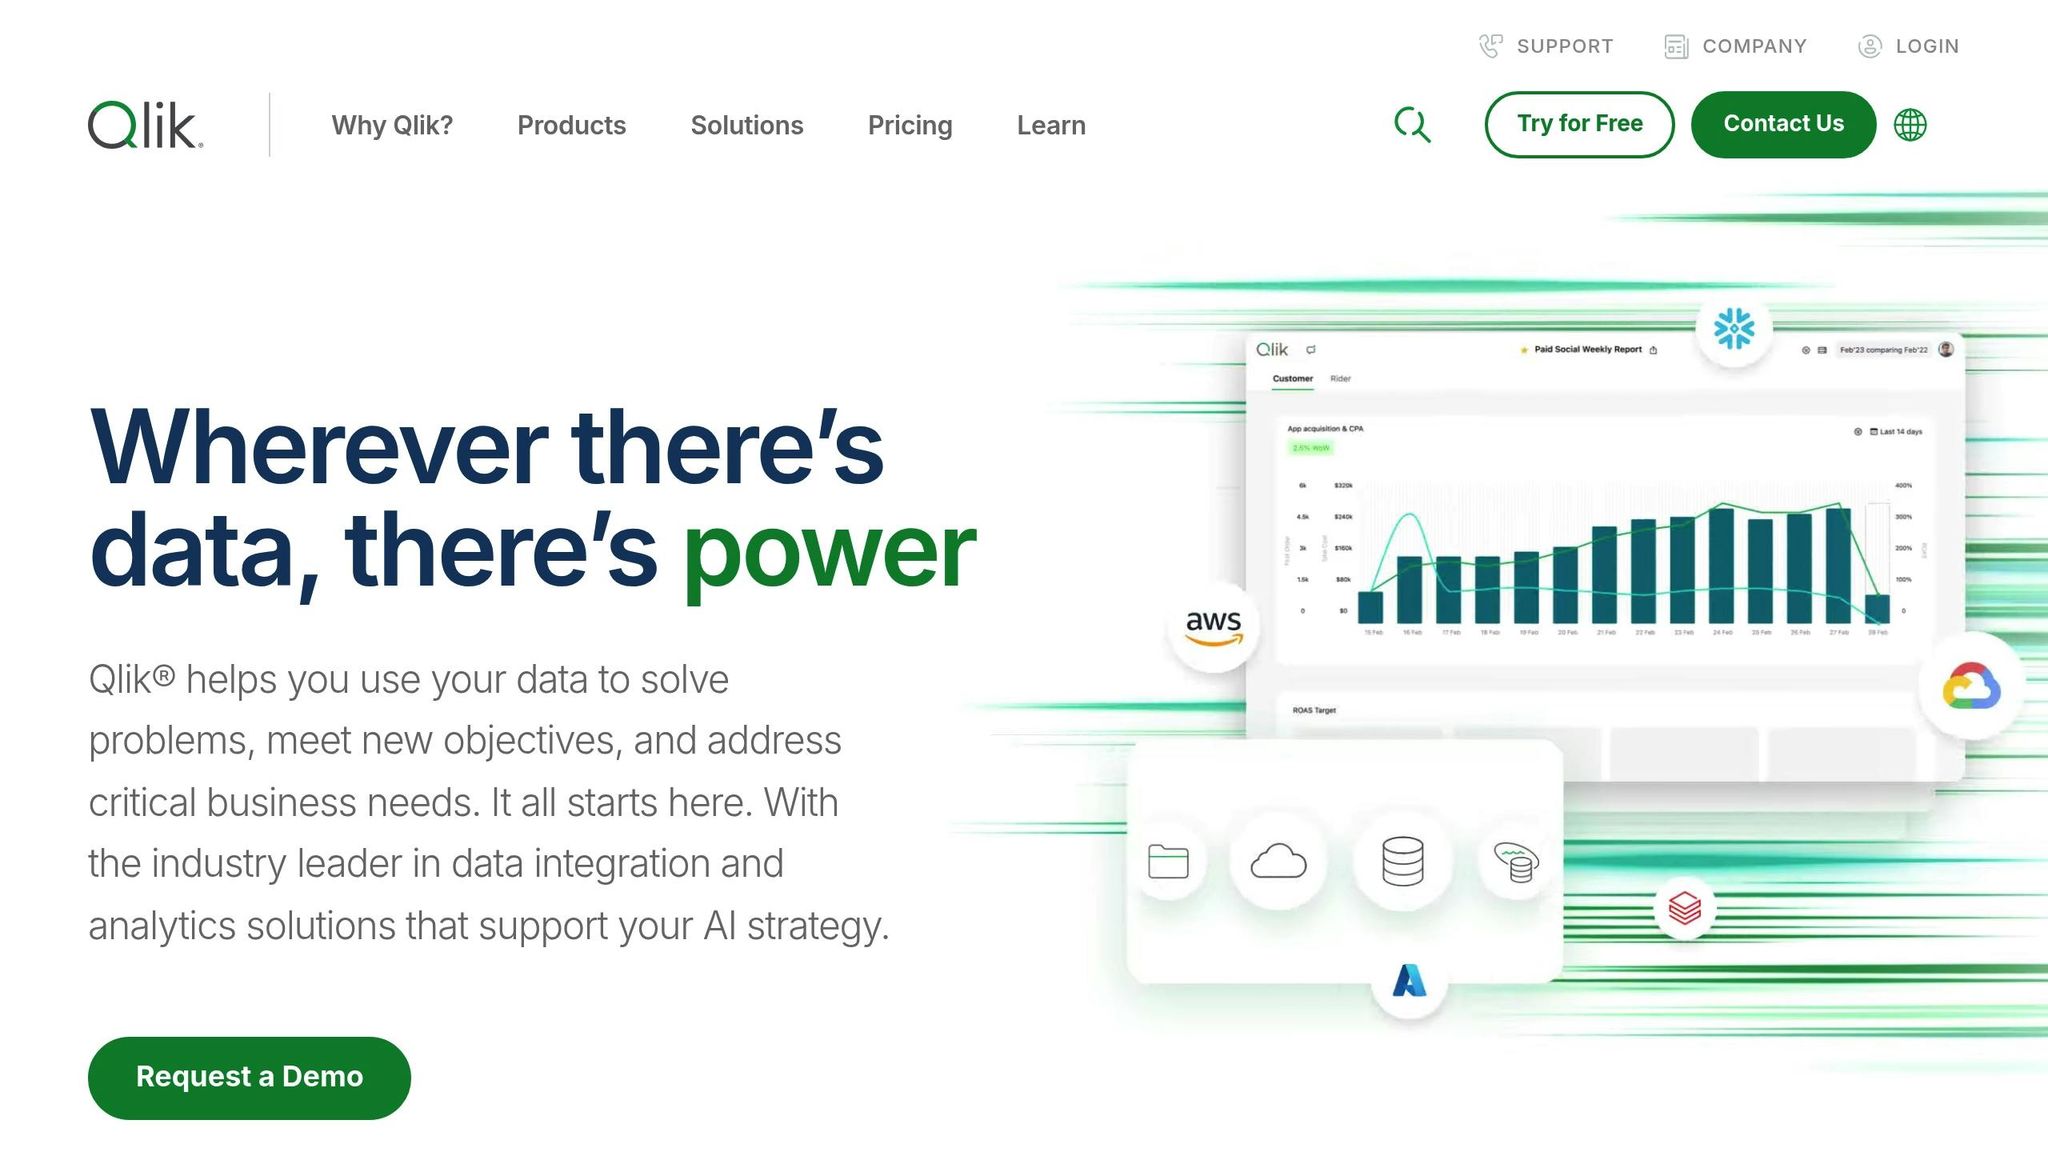
Qlik Sense

Qlik Sense uses AI-driven assistance and its associative engine to uncover hidden patterns in workforce data. This allows users to explore data intuitively and find connections that might otherwise be missed.
| Feature | Tableau | Power BI | Domo | Looker | Qlik Sense |
|---|---|---|---|---|---|
| Best For | Visual analysis | MS integration | Mobile teams | Metric creation | AI insights |
| Data Handling | Live/in-memory | 2B+ rows | Cloud-native | SQL-based | Associative |
| Key Strength | Rich visuals | Scales well | Mobile access | Data consistency | Pattern discovery |
Choosing the right tool depends on your organization's specific technical needs and infrastructure. For example, Hillsborough Community College successfully used Power BI for enrollment tracking, highlighting the importance of aligning tools with business goals.
New Developments in Workforce Dashboards
Workforce analytics is changing fast, thanks to AI and cloud technologies that are reshaping how businesses visualize and understand employee data.
AI and Machine Learning Tools
Nearly half of technology leaders now rely on AI to drive their core strategies, fundamentally changing the capabilities of workforce dashboards. Here’s how AI is making an impact:
- Predictive Analytics & Insights: By analyzing millions of data points, AI can highlight risks like employee burnout, track performance trends, and spot emerging patterns.
- Workload Optimization: AI helps balance team assignments and identifies ways to improve efficiency.
On top of analyzing trends, natural language processing (NLP) tools are being used to interpret employee sentiment.
Text Analysis Features
Today’s dashboards often include advanced NLP tools, offering features such as:
| Feature | Benefit | Impact |
|---|---|---|
| Sentiment Analysis | Tracks employee mood and satisfaction | Flags workplace issues early |
| Topic Detection | Groups feedback into themes | Highlights trending concerns |
| Multilingual Processing | Handles feedback in native languages | Enhances global insights |
"Switching to Qualtrics has enabled us to eliminate manual data processing, and focus on taking action to improve." - Justin Merry, Internal Communications Manager, HM Land Registry
In addition to text-based insights, mobile and cloud solutions are transforming how teams collaborate in real time.
Mobile and Cloud Access
Cloud-based dashboards are proving to be game changers by enabling real-time access to data and streamlining collaboration. Companies using mobile solutions have reported:
- Saving £6,500 annually on paper
- Completing invoicing 7.5 days faster
- Cutting administrative tasks by 80%
"This has helped increase our income, improve the quality of our neighbourhoods and increase our customer satisfaction." – Emma Allen, Business Improvement Manager, Housing Solutions
With 67% of leading companies adopting generative AI (GenAI), the move toward digital workforce tools is becoming the new norm.
Conclusion
The workforce analytics market, valued at $2.4 billion in 2024, is expected to grow to $9.2 billion by 2034. This growth highlights the importance of focusing on interface usability, data integration, and AI-driven features when choosing a dashboard.
Different platforms excel in specific areas: Tableau offers strong visual design (though advanced customization can be tricky), Power BI is ideal for business intelligence (often requiring skilled analysts), and Rippling stands out with its no-code reporting and integrations with over 500 applications.
AI is playing a major role in workforce analytics, with 42% of HR departments using it for talent acquisition and 36% for employee development. The efficiency gains are clear:
| Time Saved Weekly | Percentage of Users |
|---|---|
| 3–5 hours | 28% |
| 1–2 hours | 29% |
| Less than 1 hour | 23% |
| 6+ hours | 16% |
"Talent planning and management must become more strategic, more holistic, more rigorous, and more data-driven. Organizations that rebuild following traditional analog processes will be outpaced by more-prescient competitors." – Michael Mankins, Eric Garton, and Dan Schwartz of Bain & Company
The right tools can improve insights and boost operational efficiency. Look for platforms that combine real-time visualization, predictive modeling, and strong security with an easy-to-use interface. By applying these criteria, organizations can refine their workforce analytics strategy and stay ahead of the competition.